Metlifecare Ltd (MET.NZX) | 04/09/2017 | 1 Year, Daily Chart
$6.40
$6.20
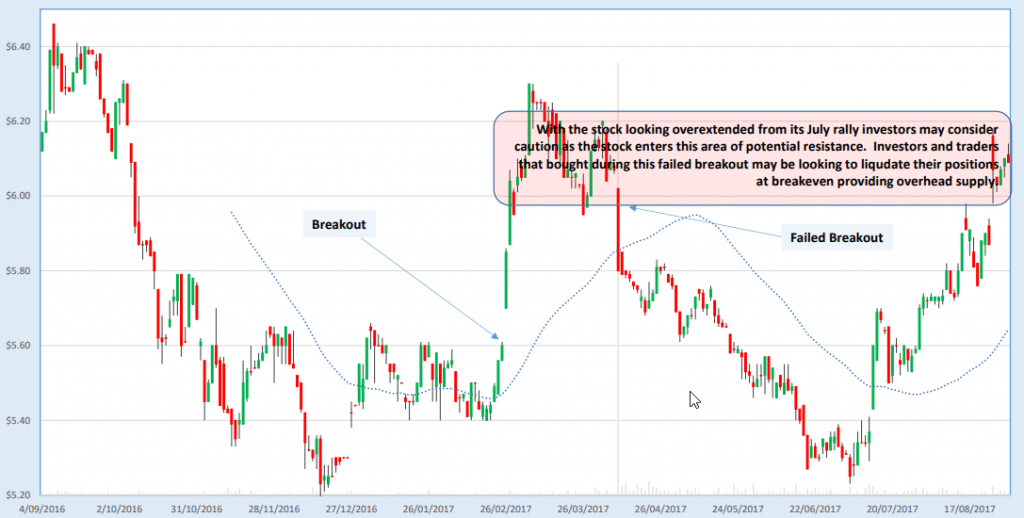
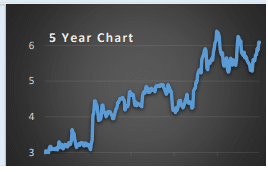
Technical Summary: The above chart shows that the stock is currently consolidating in a sideways pattern. The stock is currently ranging between $5.20 and around $6.40 per share. The chart on the right shows the 5 year, longer term performance of MET, it shows that prior to this consolidation pattern the stock was in an uptrend where the price doubled from $3 in 4 years. At the moment the stock appears to be consolidating these gains. More recently, from the 12th of July the stock has rallied from $5.40 per share, crossing above the 50-day moving average. Currently trading above $6 per share the stock appears to be over extended over the short term and is starting to meet an area of
potential resistance from earlier in the year. From a technical perspective we do not believe that the stock presents a low risk buying opportunity at the current juncture. We would like to see the stock digest its recent gains either with a constructive pull back or preferably with a sideways,
consolidation period.