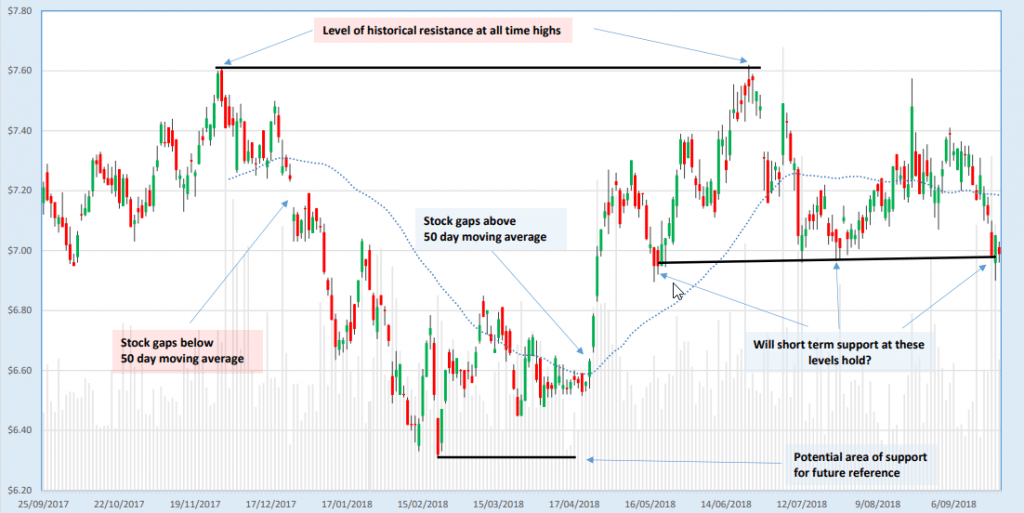
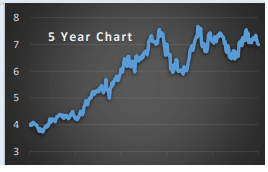
Technical Summary: After a strong run the stock of SYD has been in a consolidation phase for the last couple of years. This action has reflected on the one year chart where the stock is trading in almost the exact same place as it was a year ago. Therefore there are two questions to ask, when will the stock move out of its trading range and in which direction. Both of those questions are unknowables at this stage so it makes sense to focus on support and resistance levels. There appears to be strong resistance at all time highs, around $7.60 per share. While there are a couple of areas of support on the one year chart. Investors or traders may like to buy the stock at these areas of support subject to the levels being held.